.html)
PCA
Principal component analysis (PCA) is a method that is often used to reduce the dimensionality of data, by transforming a large set of variables into a smaller one that still contain most of the information contained in the full dataset. It can make data easier to explore and visualize. By expressing the dataset in terms of componenents (combination of variables) that contributes most to the variation in the data, the number of variables used to describe the dataset can be reduced. The cost is that some high-frequency information is lost (which can be used as a noise reduction technique).
Inputs
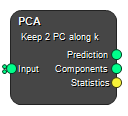
Input
Input Image(s).
Type: Image, List, Required, Single
Outputs
Prediction
Output Image(s) containing the prediction of the input data using the Number of Components defined in the Node settings.
Type: Image, List
Components
Output Image(s) containing the components found using PCA. Will have have the same dimensionality as the input data, i.e. if you input 3 frames of a time series and perform PCA along the T dimension, the number of components will be 3.
Type: Image, List
Statistics
Table(s) containing the eigen values and eigen vectors of the components.
Type: Table
Settings
Number Of Components Integer
The number of components that is used to recreate the prediction of the output data, given the input data. If the number of components is set to the same number as the dimensionality of the input data, the output will equal the input. If set to a lower value, it will contain less noise.
Dimension Selection
Along which image dimension should the PCA be performed.
Values: i, j, k, Channel
Channel Integer
Specify along which channel should the PCA be performed.
Normalize Boolean
Normalize each variable to its standard deviation before performing PCA.
See also
References
Keywords: principal component analysis, dimensionality reduction, noise reduction, eigen values, eigen vectors
Copyright © 2025, Hero Imaging AB