.html)
Histogram
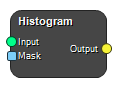
Creates a histogram from an Image. If an optional Mask is provided, the histogram is produced only for the TRUE voxels in the Mask.
Inputs
Input
Input image.
Type: Image, Required, Single
Mask
Input mask.
Type: Mask, Optional, Single
Outputs
Output
Table containing the histogram.
Type: Table, List
Settings
Histogram
Bins Integer
Set the number of bins in the histogram.
Automatic Bounds Boolean
Set the bounds of the histogram to \([min, max]\).
Lower Bound Float
Set the lower bound of the X-axis.
Upper Bound Float
Set the upper bound of the X-axis.
Bin Location Selection
X-position of the plotted points. Left - point is plotted at left side of the bin, Right - point is plotted at right side of the bin, Center - point is plotted at center of the bin, Bin Width - plotted as bars with the width of the bins.
Values: Center, Left, Right, Bin Width
Normalization Selection
Set how to normalize the y-axis. Count - no normalization, PDF - normalize as probability density, CDF - normalize as cumulative distribution function.
Values: Count, PDF, CDF
Configure
Output Name Text
Name of the output Table.
Bins Axis Name Text
Name of the bin axis.
Frequency Axis Name Text
Name of the frequency axis.
Get Histogram
By Column (i) Boolean
Get histogram by column.
By Row (j) Boolean
Get histogram by row.
By Slice (k) Boolean
Get histogram by slice.
By Channel Integers
Get histogram by channel.
See also
Keywords:
Copyright © 2023, Hero Imaging AB