.html)
Bolus Arrival Time
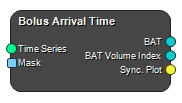
This node estimates the bolus arrival time (BAT) in a tissue region of interest (ROI) from a DCE-MRI time series. Internally, it uses a standard Parker-based AIF model [1] to create a reference enhancement curve. It then fits or “synchronizes” this reference curve to the measured signal in the selected tissue, determining the time offset at which the bolus is likely to have arrived. The estimated BAT can be used in subsequent kinetic analyses or as a reference for aligning other signals.
Optionally, a mask can be provided to restrict BAT estimation to a specific region.
Inputs
Time Series
Time-resolved signal data from a DCE-MRI sequence.
Type: NodeIOImage, Required, Single
Mask
Optional binary mask to limit BAT estimation to a specific region.
Type: NodeIOMask, Optional, Single
Outputs
BAT
The estimated bolus arrival time in seconds.
Type: NodeIONumericArray
BAT Volume Index
Index in the time-series array at which the bolus arrives (dimensionless).
Type: NodeIONumericArray
Sync. Plot
A table containing the synchronized AIF and the tissue curve, useful for visualization.
Type: NodeIOTable
Settings
Fit Duration [s] Decimal Number
The maximum time span used to fit the arrival time.
Time step [s] Decimal Number
Temporal step size used for shifting and synchronizing the AIF with the measured tissue curve.
Maximum Bolus Arrival Time [s] Decimal Number
Upper bound on the estimated bolus arrival time.
See also
- Synchronize AIF: Synchronize AIF and tissue contrast uptake curve by computing bolus arrival time shift.
References
[1] Parker, G. J. M., et al. (2006). Experimentally derived functional form for a population-averaged high-temporal-resolution arterial input function for dynamic contrast-enhanced MRI. Magnetic Resonance in Medicine, 56(5), 993–1000.
Keywords: DCE-MRI, bolus arrival time, arterial input function, time-series analysis
Copyright © 2025, Hero Imaging AB