.html)
Fit Pharmacokinetic Model
Pharmacokinetic (PK) modeling is a cornerstone of DCE-MRI data analysis. In PK modeling, we use mathematical expressions (models) to describe the exchange of contrast agent between compartments such as the intravascular space and the extravascular-extracellular space (EES). Understanding the physiological meaning of model parameters helps in diagnosing and characterizing lesions, tumors, or other pathologies by assessing angiogenesis, permeability, and blood volume.
This node is designed to fit voxel-wise concentration-time curves obtained from a Dynamic Contrast-Enhanced MRI (DCE-MRI) dataset. By modeling how a contrast agent enters and leaves the tissue compartments, it derives quantitative microvascular parameters that can be used to characterize tissue perfusion, permeability and compartment sizes. The user must provide an arterial input function (AIF), which represents the contrast agent concentration in plasma over time, as well as a concentration image (4D data) representing tissue contrast uptake.
Available PK Models
You can currently choose between three PK models in this node:
Tofts Model (sometimes referred to as the “standard Tofts model”)
The total amount of contrast agent \(C(t)\) present in tissue is modelled as
\[ C(t) =K^{trans}e^{-\frac{K^{trans}}{v_e}t} * AIF(t) , \]in which \(*\) denotes convolution and \(AIF(t)\) is the arterial input function.
- Compartments: Describes the EES as a single compartment and treats the vascular space as negligible (no explicit vp).
- Parameters:
- Ktrans: The forward transfer constant (in min⁻¹) from blood plasma to EES.
- ve: The fractional volume of the EES.
- Usage: This simpler model is appropriate when the vascular space can be considered small or of lesser interest, and when overall measurement signals are dominated by the EES uptake [1, 2].
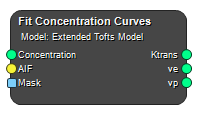
Extended Tofts Model
The total amount of contrast agent \(C(t)\) present in tissue is modelled as\[ C(t) =K^{trans}e^{-\frac{K^{trans}}{v_e}t} * AIF(t) + v_p\cdot AIF(t), \]in which \(*\) denotes convolution and \(AIF(t)\) is the arterial input function.
- Compartments: Includes both the EES and the vascular plasma space as separate compartments.
- Parameters:
- Ktrans: The forward transfer constant (in min⁻¹) from plasma to EES.
- ve: The fractional volume of the EES.
- vp: The fractional volume of blood plasma within the voxel.
- Usage: This model is particularly useful if the vascular contribution is not negligible and you want to quantify the plasma volume fraction explicitly [1, 2].
Patlak Model
For tracers that behave irreversibly during the observation window, the tissue contrast-agent concentration \(C(t)\) is\[ C(t)=K\int_{0}^{t} AIF(\tau)\,\mathrm d\tau\;+\;v_{p}\,AIF(t), \]with \(AIF(t)\) the arterial input function.
- Compartments: Vascular plasma space and an extravascular space where tracer becomes trapped (no back-flux during the fit window).
- Assumptions:
- Back-diffusion to plasma is negligible.
- Capillary plasma concentration equals the measured AIF.
- System is linear and time-invariant once trapping begins.
- Parameters:
- K: Net influx (uptake) rate constant [min⁻¹].
- vp: Fractional plasma volume.
- Usage: Appropriate for slowly enhancing tissue (e.g., intact or mildly disrupted BBB) or for early-time analyses when bidirectional models are poorly identifiable.
Patlak plot: dividing by \(AIF(t)\) gives
\[ \frac{C(t)}{AIF(t)} \;=\; K\,\frac{\displaystyle\int_{0}^{t}AIF(\tau)\,\mathrm d\tau}{AIF(t)} \;+\; v_{p}, \]so a plot of \(C(t)/AIF(t)\) versus the normalized integral is linear, with slope \(K\) and intercept \(v_{p}\).
Inputs
Concentration
Voxel-wise contrast agent concentration data over time (4D). Derived from signal intensity data after converting to contrast concentration. The unit of concentration must be the same as for the AIF.
Type: Image, Required, Single
AIF
Arterial Input Function (AIF) as a table of timestamps and corresponding contrast concentration in plasma. The unit of concentration must be the same as for the tissue concentration.
Type: Table, Required, Single
Mask
An optional mask to restrict parameter estimation to a region of interest (ROI).
Type: Mask, Optional, Single
Outputs
Depending on the chosen PK model, different parameter maps are generated:
If Tofts Model is selected
Ktrans
Estimated Ktrans (min⁻¹), indicating how fast contrast flows from plasma into the EES.
Type: Image
ve
Estimated ve, the fractional volume of the EES.
Type: Image
If Extended Tofts Model is selected
Ktrans
Estimated Ktrans (min⁻¹), indicating how fast contrast flows from plasma into the EES.
Type: Image
ve
Estimated ve, the fractional volume of the EES.
Type: Image
vp
Estimated vp, the fractional plasma volume.
Type: Image
If Patlak Model is selected
K
Estimated K (min⁻¹), indicating how fast contrast flows from plasma into the irriversible compartment.
Type: Image
vp
Estimated vp, the fractional plasma volume.
Type: Image
Settings
PK Model Selection
Select which pharmacokinetic model to fit.
- Tofts Model: Fits Ktrans and ve.
- Extended Tofts Model: Fits Ktrans, ve, and vp.
- Patlak Model: Fits K and vp.
Values: Tofts Model, Extended Tofts Model, Patlak Model
Algorithm Selection
Choose the mathematical approach for parameter fitting. Currently, only Linear is available, which provides a fast method for estimating PK parameters and is based on the work by Murase [4].
Values: Linear
Patlak Model Settings
Linear Phase Start Time [s] Float
Start time for the fit of the model.
See also
- Quantify ContrastAgent Quantify contrast agent concentration.
Keywords: DCE-MRI, Pharmacokinetic Modeling, Tofts, Extended Tofts, Patlak, Ktrans, ve, vp
References
[1] Tofts, P. S. (1997). Modeling tracer kinetics in dynamic Gd-DTPA MR imaging. Journal of Magnetic Resonance Imaging, 7(1), 91–101.
[2] Tofts, P. S., et al. (1999). Estimating kinetic parameters from dynamic contrast-enhanced T1-weighted MRI of a diffusable tracer: Standardized quantities and symbols. Journal of Magnetic Resonance Imaging, 10(3), 223–232.
[3] C. S. Patlak, R. G. Blasberg & J. D. Fenstermacher, “Graphical evaluation of blood-to-brain transfer constants from multiple-time-uptake data,” J Cereb Blood Flow Metab., 3 (1): 1-7, 1983.
[4] Murase K. Efficient method for calculating kinetic parameters using T1-weighted dynamic contrast-enhanced magnetic resonance imaging. Magn Reson Med. 2004 Apr;51(4):858-62.
Copyright © 2025, Hero Imaging AB