.html)
Quantify Contrast Agent
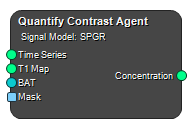
This node converts a dynamic MRI signal to contrast agent concentration (in mM). It does so by accounting for each voxel’s baseline T1, the relaxivity properties of the contrast agent and relative signal change in the dynamic data. The node supports multiple signal models (SPGR, Full SPGR, and Linearized SPGR). By providing a T1 map and the associated metadata (e.g., flip angle, repetition time, and echo time), this node estimates the time-resolved concentration of the administered contrast agent. The resulting concentration images can then be used for pharmacokinetic (PK) modeling or other DCE-MRI analyses.
Inputs
Time Series
A dynamic MRI time series (e.g., Spoiled gradient echo (SPGR) images acquired at multiple time points).
Type: Image, Required, Single
T1 Map
A baseline T1 relaxation time map, crucial for conversion of signal to contrast concentration. Should be in milliseconds.
Type: Image, Required, Single
BAT
Bolus arrival time in seconds, used to identify the end of the baseline period and start of contrast arrival.
Type: Numeric Array, Required, Single
Mask
An optional mask that restricts the analysis to specific voxels. If not provided, all voxels are analyzed.
Type: Mask, Optional, Single
Outputs
Concentration
Estimated contrast agent concentration (in mM) at each time point.
Type: Image
Settings
Configure
Signal Model Selection
Selects the model that maps signal intensities to longitudinal relaxation changes. All SPGR models are based on the signal equation:
- Spoiled Gradient Echo Signal
- Exponential Relaxation Factors
- Relaxation-Time Dependence on Contrast
| Symbol | Definition/Description | Typical Units |
|---|---|---|
| \(S\) | Measured signal intensity in the spoiled gradient echo sequence | Arbitrary (scanner units) |
| \(\rho\) | Proton density or scaling factor for signal amplitude | Dimensionless |
| \(\theta\) | Flip angle (the rotation applied by the RF pulse) | Degrees |
| \(T_R\) | Repetition time (time between successive excitations) | ms (milliseconds) |
| \(T_E\) | Echo time (time from the excitation to the peak of the echo signal) | ms (milliseconds) |
| \(E_1\) | Factor describing longitudinal (\(T_1\)) relaxation over \(T_R\). Defined by \(E_1 = e^{-T_R / T_1}\) | Dimensionless |
| \(E_2\) | Factor describing transverse (\(T_2^*\)) decay over \(T_E\). Defined by \(E_2 = e^{-T_E / T_2^*}\) | Dimensionless |
| \(T_1\) | Effective longitudinal relaxation time in the presence of contrast agent | ms (milliseconds) |
| \(T_{10}\) | Baseline longitudinal relaxation time (no contrast agent) | ms (milliseconds) |
| \(r_1\) | Longitudinal relaxivity constant, which scales how much the contrast agent shortens \(T_1\) | \(mM^{-1}s^{-1}\) (per millimolar and second) |
| \(C\) | Contrast agent concentration | mM (millimolar) |
| \(T_2^*\) | Effective transverse relaxation time in the presence of contrast agent | ms (milliseconds) |
| \(T_{20}^*\) | Baseline effective transverse relaxation time (no contrast agent) | ms (milliseconds) |
| \(r_2^*\) | Transverse relaxivity constant, which scales how much the contrast agent shortens \(T_2^*\) | \(mM^{-1}s^{-1}\) |
Possible selections
SPGR: Simplified spoiled gradient echo signal model, ignoring \(T_2^*\) and valid when \(T_2^*\) effects are small, i.e. moderate contrast agent concentration. Using this model it is assumed that the \(E_2\) term does not change with \(C\). The concentration is solved analytically using the SPGR signal equation and the relaxation time dependence of the contrast agent. This method is commonly used and fast. It can result in some errors at peak concentrations in vessels, and it is somewhat prone to producing very large erroneous concentrations in some pixels.
Full SPGR: Spoiled gradient echo model that incorporates \({T}_2^*\) effects (via \(r_2^*\) and echo time). The concentration is solved for numerically using the full SPGR signal equation and relaxation time dependence of the contrast agent. To prevent outliers, signals larger than the model can produce, results in the maximum concentration that the model can produce. To give unbiased estimation in low signal and low concentration regions the signal enhancement vs concentration model is made a symmetric odd function around the origin.
Linearlized SPGR: A linear approximation valid under the assumptions of small flip angle, short TR and low concentration. With this selection the concentation is computed using:
In the equation above \(\Delta(t )\) is the signal enchancement relative to the signal at \(t = 0\), i.e. \(\Delta(t ) = S(t ) / S(0)\).
Values: SPGR, Full SPGR, Linearlized SPGR
r1 [mM¯¹s¯¹] Float
Longitudinal relaxivity of the contrast agent \(r_1\).
r2* [mM¯¹s¯¹] Float
Transverse relaxivity for \(\mathrm{T}_2^*\). This is relevant only in the Full SPGR model.
Metadata
Metadata Source Selection
Determines how flip angle [degrees] and repetition time [ms] (and echo time [ms]) are retrieved. Can come directly from the time series metadata or from user-provided numeric values. When provided by the user, these values should be single scalars.
Values: Time Series, Numeric Array Input
Flip Angle Text
Name of the flip angle variable in the metadata. Used in the SPGR and Full SPGR model. Unit: Degrees.
Repetition Time Text
Name of the repetition time variable in the metadata. Used in the SPGR and Full SPGR model. Unit: ms.
Echo Time Text
Name of the echo time variable in the metadata. Used in the Full SPGR model. Unit: ms.
See also
- Fit Concentration Curves: Fit pharmacokinetic models to concentration curves.
Keywords: T1 Map, Relaxivity, Concentration, DCE-MRI
References
[1] Tofts PS. Modeling tracer kinetics in dynamic Gd-DTPA MR imaging. J Magn Reson Imaging. 1997;7(1):91-101.
[2] Hittmair K, Gomiscek G, et al. Method for the quantification of contrast agent uptake in dynamic contrast-enhanced MRI. Magn Reson Med. 1994;31(5):567-571.
Copyright © 2025, Hero Imaging AB