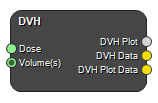
DVH
Class: NodeDoseVolumeHistogram

A dose-volume histogram relates the radiation dose to the tissue volume and summarizes a 3D dose distribution to a graphical 2D format. The node produces the cumulative dose-volume histogram for the supplied dose matrix and structure(s). The structures are supplied as images (i.e. Smooth masks) to ensure that the output values are accurate.
Example workflows
Inputs
Dose
An image containing the dose matrix to be evaluated. This image is normally produced by importing a DICOM RT DOSE, or RD file.
Type: Image4DFloat, Required, Single
Volume(s)
One or multiple Smooth Mask(s), describing the structures for which the DVH should be produced. They must be of the same matrix size as the dose image.
Type: Image4DFloat, Required, Multiple
Outputs
DVH Plot
A plot contains the DVH. The DVH can be viewed in the Node Output panel, in the Plot pane.
Type: CurveCollection
DVH Data
A table containing the DVH parameters. Basic parameters include image and structure information, such as names and volume. It also includes Dmin, Dmax and Dmean by defeault. It also includes other parameters that are specified in the Node Settings panel, for example D95.
Type: DataCollection
DVH Plot Data
A table with the DVH plot data, so that the user can plot the DVHs using any other software. The first column lists the dose levels (x-axis) and each of the following columns contain the volume levels (y-axis) for a specific structure specified by the Smooth Mask(s).
Type: DataCollection
Settings
Structures
For detailed explanations on supersampling of structures, see Struct Processor.
Render Structures Boolean
Renders all structures available in a connected RT-Struct collection, instead of connecting multiple Smooth Masks, on the connected Dose input to produce DVH data.
Maximum Volume Error(%) Number
The tolerance of difference between the numeric volumes calculated directly from the RT-struct polygons and the rendered Smooth Mask.
Maximum Iterations Integer
Sets the maximum number of iterations of adaptive supersumpling to reach Maximum Volume Error (%) before breaking.
Use Error Stopping Criteria Boolean
If set, the automatic upsampling will stop if the volume error doesn't change between iteration.
Error Stopping Criteria(%) Number
If using error stopping criteria the automatic upsampling will stop if the absolute volume error doesn't change by at least this much compared to the error of the previous iteration.
End Cap Thickness (mm) Number
Sets the end cap thickness to use when rendering structures
Histogram
Title Text
Title of the diagram.
Minimum Dose(Gy) Number
Minimum dose of the histogram.
Maximum Dose(Gy) Number
Maximum dose of the histogram.
Bins Integer
Number of bins in the histogram.
Analysis
Prescribed Dose(Gy) Number
Set the prescribed dose. Used to calculate relative dose (needed in e.g. V90%).
Dose Levels Text
Set the dose levels of interest to be explicitly displayed in the DVH Data output. Supplied as a comma separated list, so if you want D2 and D98, write “2, 98”.
Volume Levels(%) Text
Set the volume levels of interest to be explicitly displayed in the DVH Data output. Supplied as a comma separated list, so if you want V10 and V60, write “10, 60”.
Volume Levels(Gy) Text
Set the volume levels of interest to be explicitly displayed in the DVH Data output. Supplied as a comma separated list, so if you want V5Gy and V10Gy, write “5, 10”.
Output Absolute Volume Boolean
Output volume in cc instead of %.
References
See also
Keywords: DVH, Dose-volume histogram, Smooth Mask
Copyright © 2022, NONPI Medical AB
