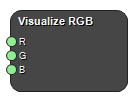
Visualize RGB
Class: NodeImageVisualizeRGB

Sometimes the provided colormaps are not sufficient when displaying the colors of an image. This node can visualize three images as the red, green and blue channels of an RGB image. The inputs can be three separate R, G, and B images, a vector image where the vector components x, y and z will be shown as the red, green and blue channels respectively; and a time series where the three frames will be displayed as red, green and blue respecively.
Example Workflows
Inputs
R
The red channel.
Type: Image4DFloat, Required, Single
G
The green channel.
Type: Image4DFloat, Required, Single
B
The blue channel.
Type: Image4DFloat, Required, Single
Settings
Input Type Selection
Select the input format of the RGB data.
If the R, G, and B channels are times series (or have multiple frames) they need to be supplied as separate R, G and B channels. The number number of frames of the R channel will determine the number of frames of the RGB image. If the G or B channels have fewer frames, the last frame will be repeated to match the red channel frame count.
Values: RGB, Frames, VectorField
Viewport Integer
Set the target viewport number.
Layer Integer
Set the layer in which the image or mask will be displayed. The bottom layer is layer 1.
Lock Viewport Boolean
Set to TRUE if you want to lock the viewport coordinate system to other viewports.
Window Min Number
Set the min value.
Window Max Number
Set the max value.
Slice Integer
Select the slice to display. A slice of 0 means the middle slice will be selected.
Frame Integer
Select the frame to display.
Orientation Selection
Select the projection of the image, which can be axial (AX), sagittal (SAG), coronal (COR) or a 3D rendering (XYZ).
Values: AX, SAG, COR, XYZ
Interpolation Selection
Set the image interpolation.
Values: Cubic, Linear, Nearest
See also
Keywords:
Copyright © 2022, NONPI Medical AB
