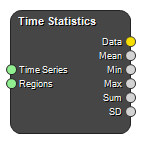
Time Statistics
Class: NodeTimeStatisticsRegion
Calculate statistics of a time series, frame-by-frame, in supplied regions. The output Data Table is similar to the Statistics node, but in this node statistical properties are calculated frame-by-frame.
Example Workflows
Inputs
Time Series
An image time series.
Type: Image4DFloat, Required, Single
Label Maps
A Label map image where statistical properties should be calculated.
Type: Image4DFloat, Required, Single
Outputs
Data
A Data Table with the statistical properties of the image in the different labels.
Type: DataCollection
Mean
A plot showing the mean value for each frame and label.
Type: CurveCollection
Min
A plot showing the minimum value for each frame and label.
Type: CurveCollection
Max
A plot showing the maximum value for each frame and label.
Type: CurveCollection
Sum
A plot showing the sum for each frame and label.
Type: CurveCollection
SD
A plot showing the standard deviation for each frame and label.
Type: CurveCollection
Settings
Tag Text
The name of the data. If you export the data to .xls or .csv, this will be used as the file name.
See also
Keywords:
Copyright © 2022, NONPI Medical AB